Animating geometrical inversions
An old project (March 2020) using HTML5's canvas to visually animate inversions.
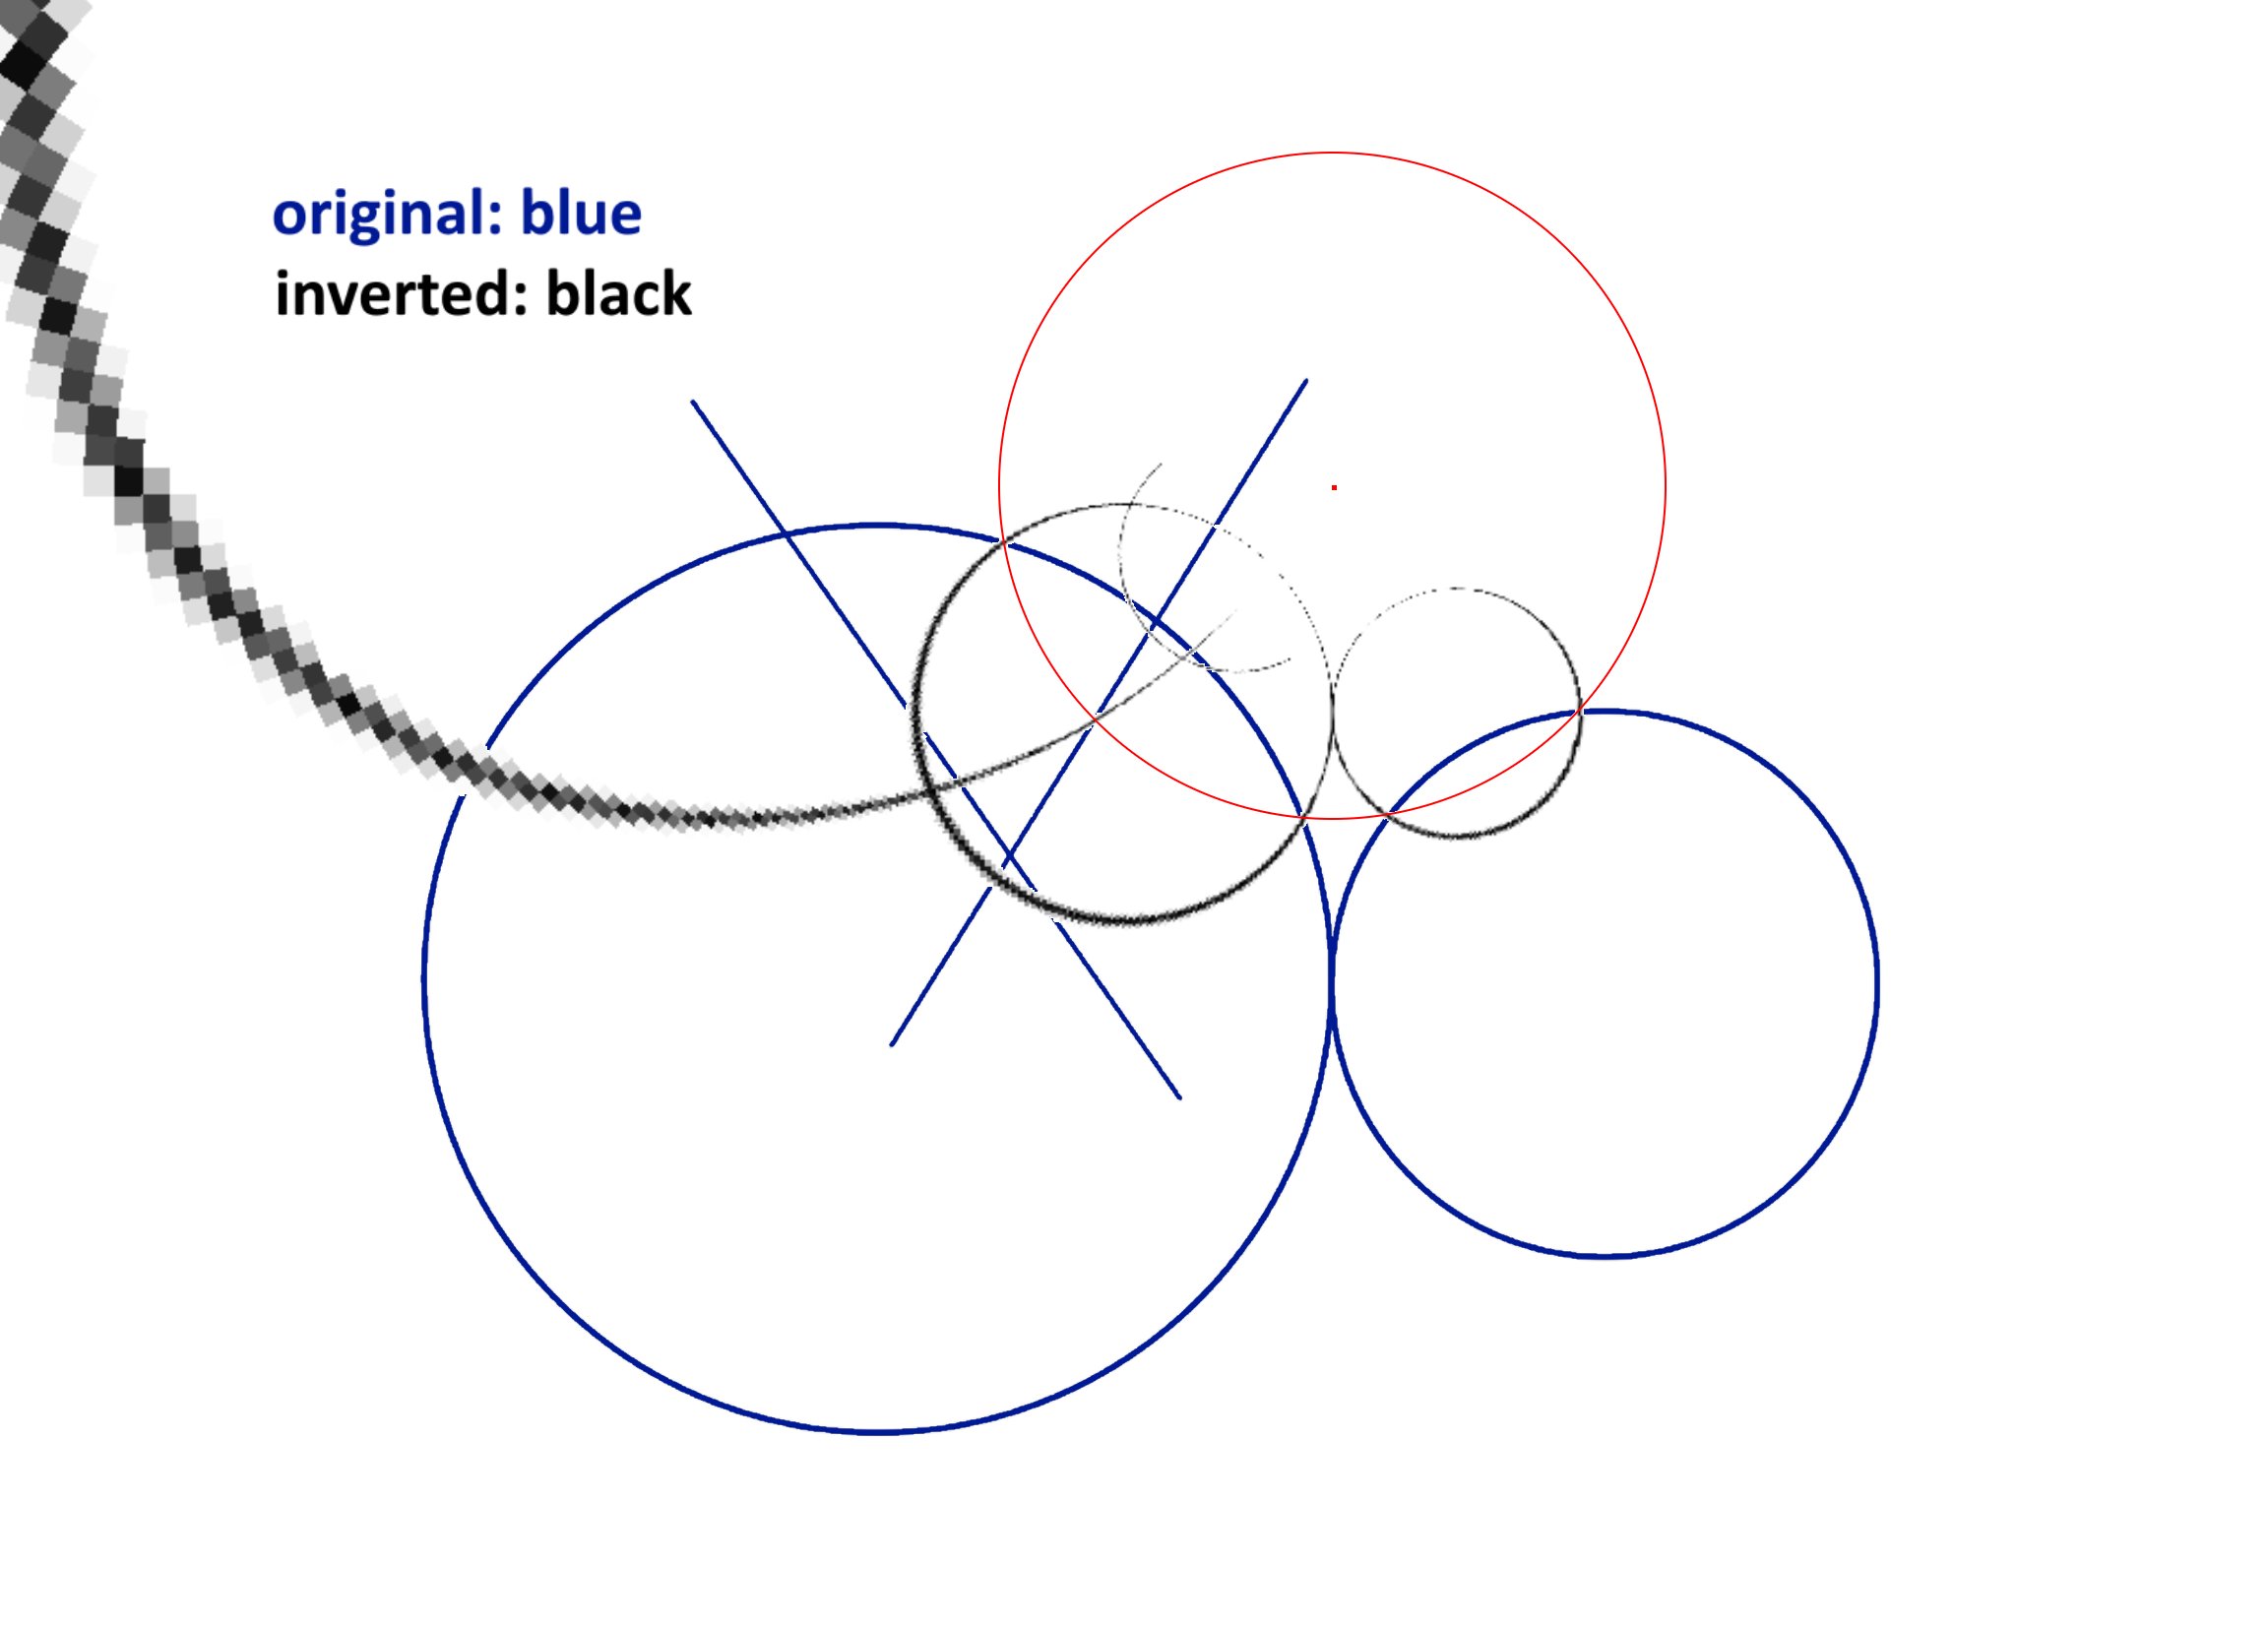
Out of all of the random projects I’ve done, this project probably took the least inspiration. Before I had even learnt about the mathematical implications of inversion, I had already made this tool. This tool can take an image and then animate its inversion about any circle in the image
Note: this tool is just that - a tool. I unfortunately never designed this to be user friendly or stable - just stuck some code together that worked and then put it on the internet for the world to see and critique.
As such, here are some instructions for this tool:
- Upload an image using the file picker or pick a preset image using the buttons (Apollonian gasket, shoemaker's knife e.t.c.)
- Click to choose a point to be the center of the circle you invert around (red dot). Then press Next.
- Click again to choose a point on the radius of the circle you wish to invert around (red circle). Then press the button.
- The tool will animate an inversion of the image on the canvas.
- Once the animation is complete, you can click again on the canvas to change the radius of the circle that you are inverting around (effectively zoom in and out)
If you wish to animate another image, you can upload an image again. Note this doesn’t work in some cases, and you should then try reloading the page.
With that out of the way, here is the previously mentioned tool:
I personally find this to be quite a useful way to quickly invert a GeoGebra diagram to spot for patterns in a problem.
How it works for mathematicians
Before I get to the maths for this animation, I’ll quickly explain inversion.
(If you know inversion, you’ll probably be good enough at maths to work out how the animation works yourself anyway, and I suggest you try to work it out yourself first as a fun exercise)
What is inversion?
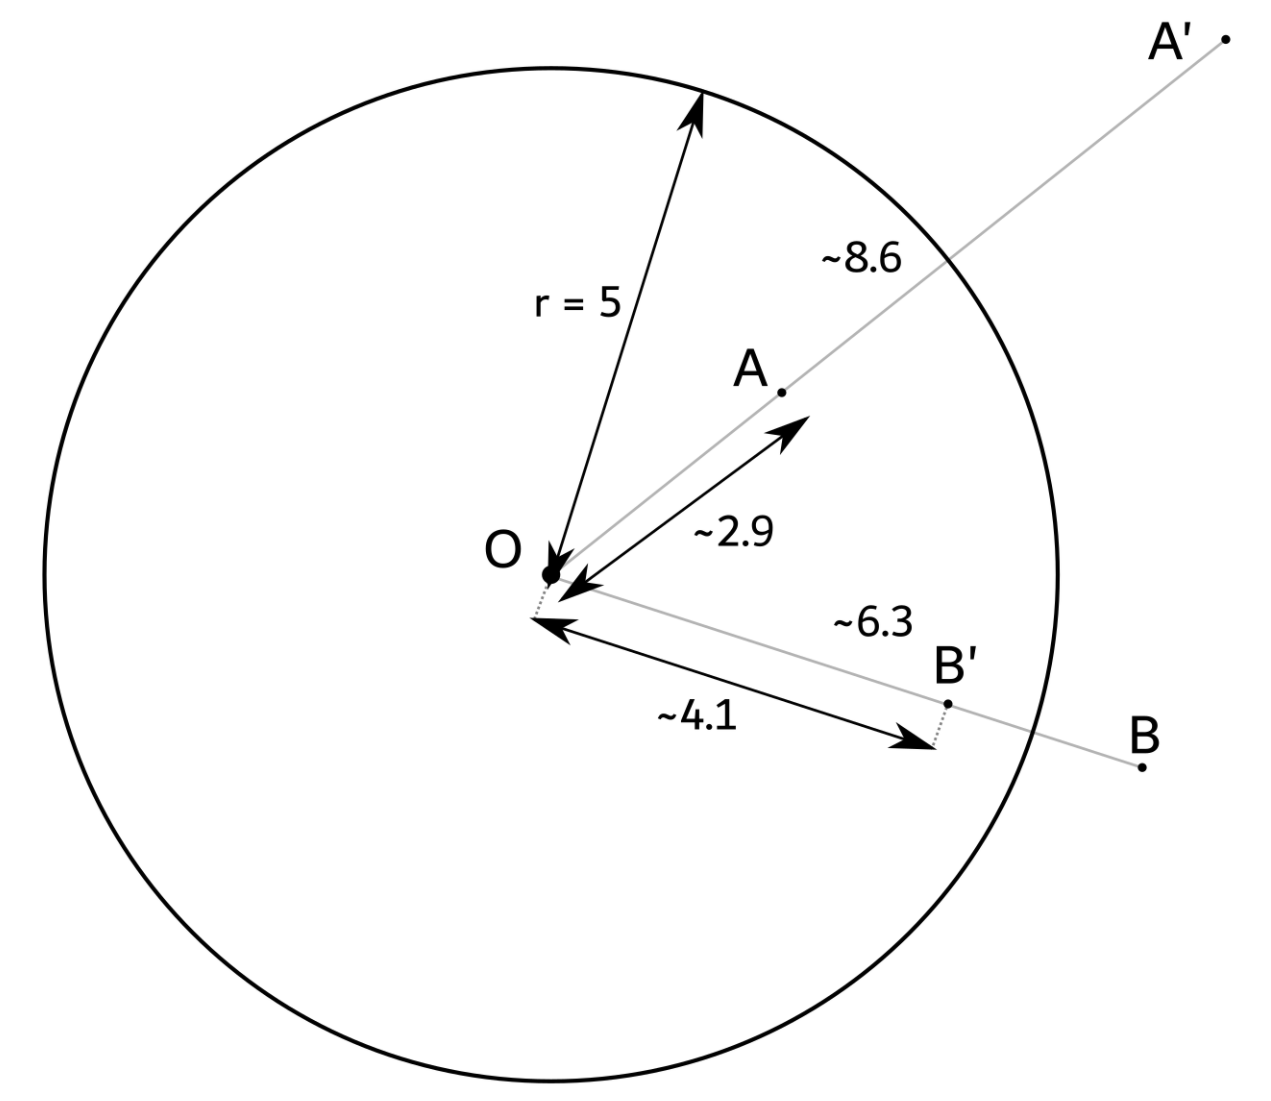
An inversion is an operation that is said to be “about” a circle \(Γ\). If we let \(Γ\) have center \(O\) and radius \(r\), any point \(X\) in the plane will go to the point \(X'\) that lies on the ray \(OX\) and such that \(OX' = \frac{r^2}{OX}\).

Note that the point \(O\) goes to an undefined point (as when \(X\) is \(O\), the distance \(OX = 0\) and thus \(OX'\) is undefined). To solve this problem, we define a point at infinity \(P_{\infty}\), and say that \(O\) goes to \(P_{\infty}\) and \(P_{\infty}\) goes to \(O\) under an inversion. The point \(P_{\infty}\) is infinitely far from every other point on the plane, and the point \(P_{\infty}\) will pass through every single straight line but no circles.
The natural question to ask now is “why would you do this?”.
The reason is that inversion preserves a lot of important properties, including tangency and intersections.

It also affects circles, lines and points in the following ways:
- All points on the circle of inversion are left unchanged
- All circles that don’t pass through O are inverted to other circles
- All lines that don’t pass through O are inverted to circles that pass through O
- All lines that pass through O are left unchanged.
- All circles that pass through O are inverted to lines that don’t pass through O
This last one is the most powerful - inversion lets us turn circles into lines.
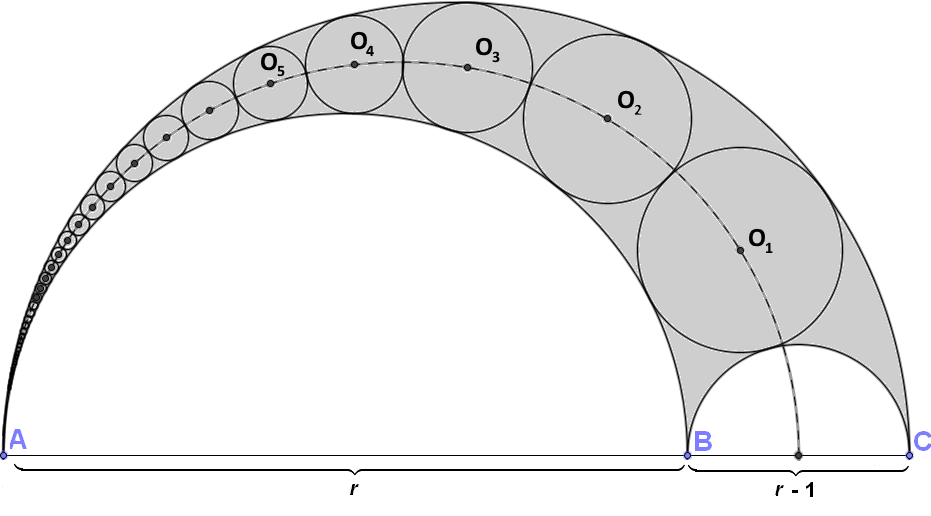
Let’s take a look with one of the examples - the Shoemaker’s knife.

In the Shoemaker’s knife, we wish to prove that the distance from \(O_n\) to \(AC\) is n times \(r_n\), where \(r_n\) is the radius of the nth circle.
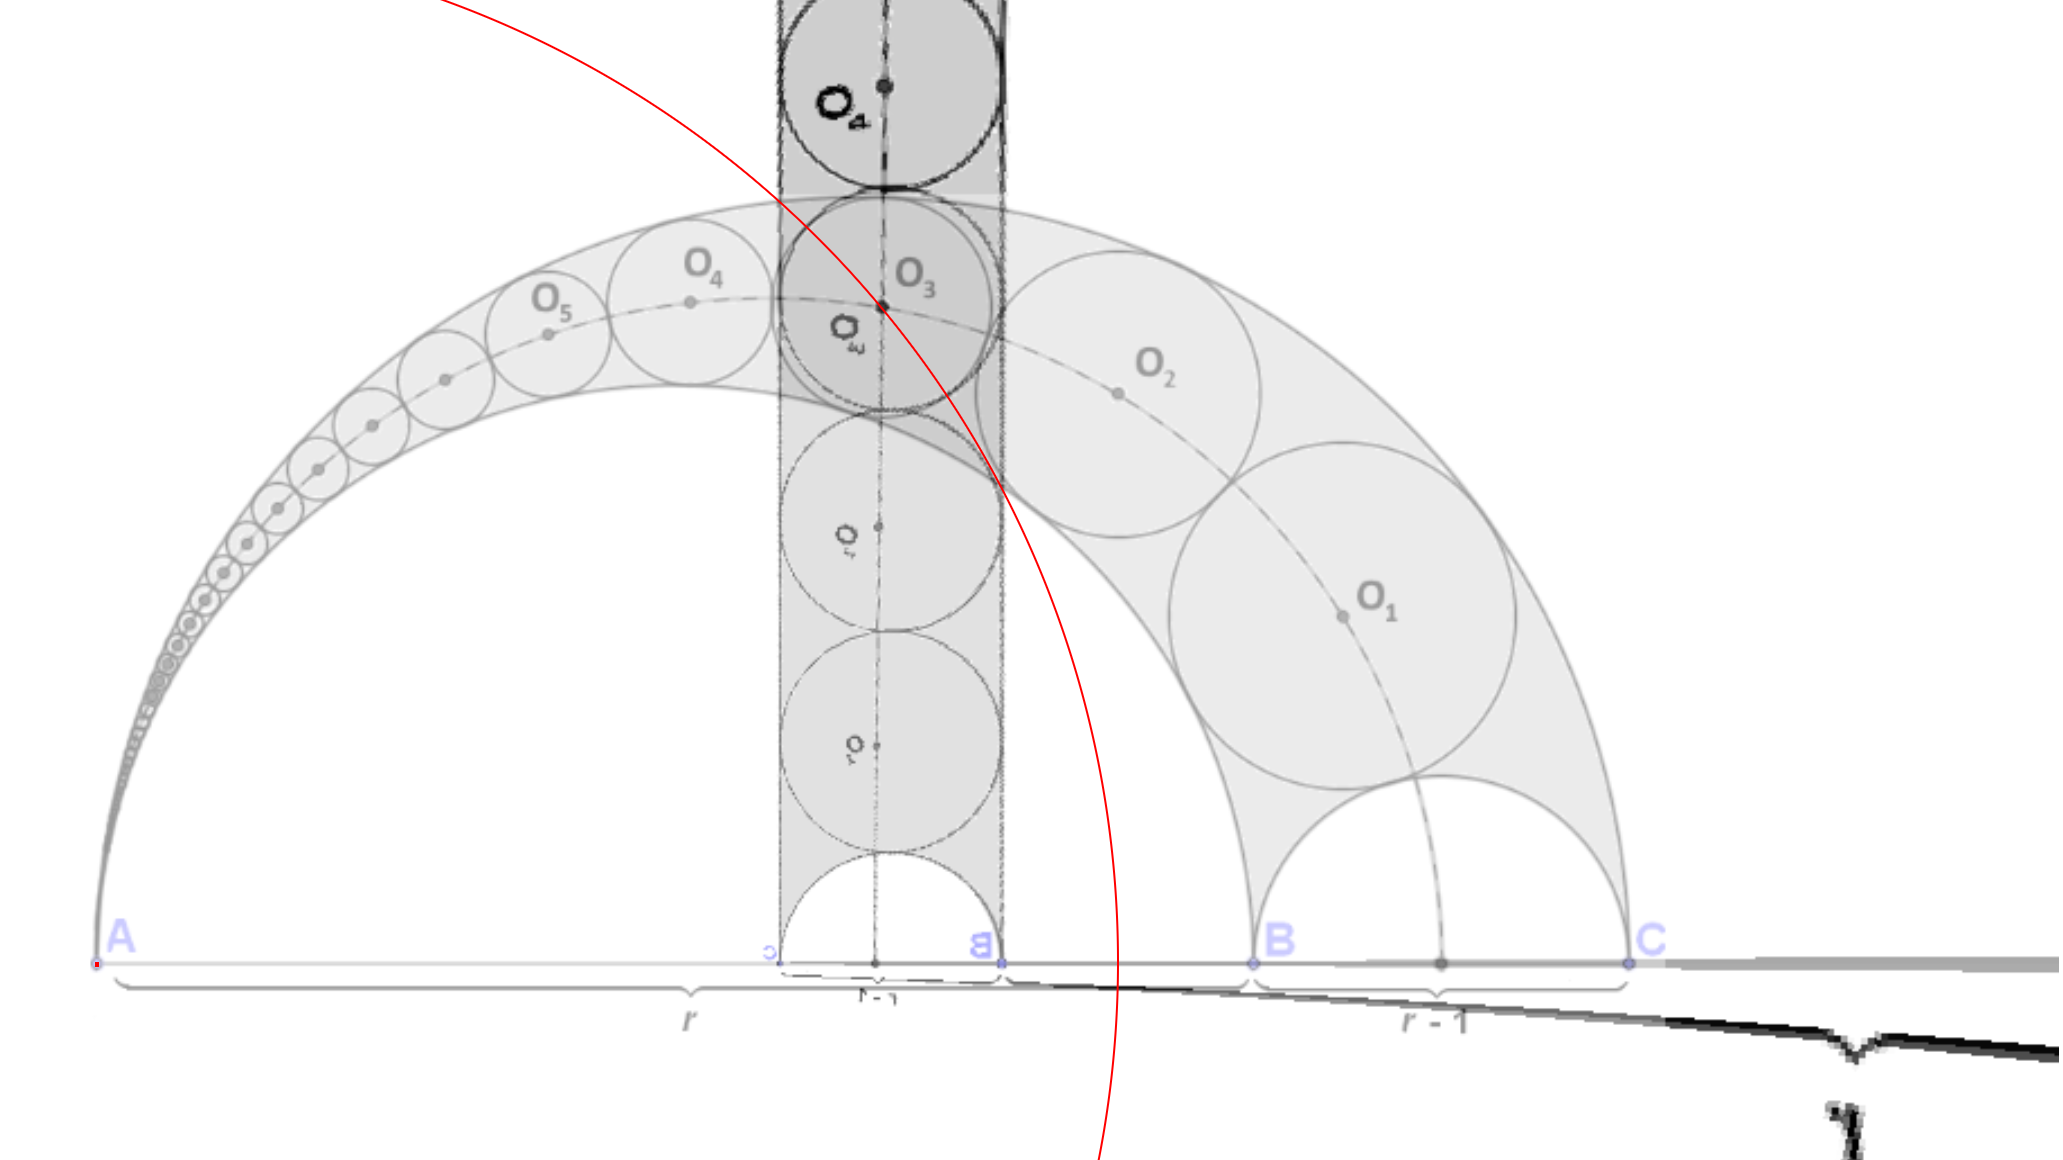
Invert about the circle with center \(A\) with a radius such that the circle centered at \(O_n\) is left unchanged.
Now, the arc \(AB\) and \(AC\) are parts of circles that pass through \(A\). Therefore, they invert to straight lines. It can be shown that these lines are perpendicular to \(AC\). As all of the circles are tangent to these lines, all circles line up in between these two lines, but they now all have the same radius.

Overlaying the original diagram over the inverted diagram makes the final conclusion seem obvious. The “0th” circle is mapped to a circle still centered on \(AC\), and then n circles up is the circle centered on \(O_n\), in its original position. From here, we can conclude that the distance from \(O_n\) to AC is n times \(r_n\).
Making the animation
In the inversion, every single point \(P\) goes to some point \(P'\), and \(P'\) goes to the point \(P\). I wished to animate \(P\) swapping with \(P'\), so at some time \(t\) (where \(t\) is a fraction from 0 to 1), \(P\) will be at some point \(X\) such that \(PXP'\) is straight and \(P\) has moved \(t\) of the way through to \(P'\). If \(t = 0\), \(P\) will be at \(P\), while if \(t = 1\), \(P\) will be at \(P'\).
If we let \(OP = d\), then \(OP' = \frac{r^2}{d}\) (\(r\) is the radius of inversion). At some time \(t\), the point \(P\) will be mapped to the point on the ray \(OP\) with distance \(d + t(\frac{r^2}{d} - d)\) from \(O\).
However, we can do this in reverse. For any point \(X\), at time t, it will contain the colour of two original points \(S\) and \(T\) on the line \(OP\). We can find the distances as \(OX = d + t(\frac{r^2}{d} - d)\). This is quadratic in \(d\), and the two solutions for \(d\) give the two distances of the original points.
My program iterates through 100 different values of t, and at each value, it scans over the canvas and finds the two points in the original image that are at that point at that t of the inversion animation. It then averages their colour and draws it on the canvas to animate the inversion.
How it works for programmers
Handling the image inputs
First, my program needs to take an image as an input and display it on the canvas. However, I also need to do the same thing for the buttons for the preset images, and so I’d like to avoid repetition of code. To do this, I will write one function that handles Blob s. Blobs are representations of raw files in JavaScript.
The handleImageBlob function uses a FileReader to read the image blob. It then clears the canvas and sets the canvas to an appropriate size, before drawing the image onto the canvas.
function handleImageBlob(blob) {
    var reader = new FileReader();
    reader.onload = function (event) {
        img = new Image();
        img.onload = function () {
            // we want the width to be at most 60% and height to be at most 50%
            // calculate what the width will be
            stage = 0;
            ctx.rect(0, 0, canvas.width, canvas.height);
            var containerwidth = document.getElementById("wrapper").offsetWidth;
            var widthonpage = Math.min(containerwidth * 0.66, img.width, 700);
            var ratio = widthonpage / img.width;
            canvas.width = widthonpage * 1.5;
            canvas.height = img.height * ratio * 1.5;
            imgposX = (canvas.width - widthonpage) / 2;
            imgposY = (canvas.height - (img.height * ratio)) / 2;
            imgsizeX = widthonpage;
            imgsizeY = img.height * ratio;
            ctx.drawImage(img, imgposX, imgposY, imgsizeX, imgsizeY);
        }
        img.src = event.target.result;
    }
    reader.readAsDataURL(blob);
}
I then write two functions. The first is to handle the user file input. To do this, I will obviously need an <input type="file" />
. I bind the function handleImage to the onchange of this input, and I read the blob of the input file from the event.
function handleImage(e) {
    handleImageBlob(e.target.files[0]);
}
The second function deals with the preset images, and as a full disclosure, I do not do this well in this program. Here, I store base64s of preset images in an array, and use the fetch API to convert them into Blobs. Ideally, I would download these images from elsewhere or store them somewhere else in the HTML even, but I wanted to implement this quickly, and sticking kilobytes of base64 encoded PNGs into the JS file itself seemed the easiest.
(In the function below, base64s is the array that contains the base64 encoded images as strings)
function handleImageb64(idx) {
    var url = base64s[idx];

    fetch(url)
        .then(res => res.blob())
        .then(handleImageBlob);
}
Drawing the circle
To draw the circle, I detect where the user clicks on the canvas, and use CSS absolute positioning to put the dot or circle in the right spot.
I have a variable (stage) that represents what point of the process we are in (stage 0 is picking the center point, stage 1 is picking the radius and stage 2 is changing the radius post animation)
document.getElementById("wrapper").addEventListener("click", function (e) {
    if (stage == 0) {
        var pos = getCursorPosition(canvas, e);
        point = pos;
        document.getElementById("redpoint").style.top = pos.y + "px";
        document.getElementById("redpoint").style.left = pos.x + "px";
        document.getElementById("notice").innerHTML = "Pick a point";
    }
    else if (stage == 1) {
        var pos = getCursorPosition(canvas, e);
        radius = Math.sqrt(((pos.x - point.x) * (pos.x - point.x)) + ((pos.y - point.y) * (pos.y - point.y)));
        document.getElementById("circle").style.top = point.y - radius + "px";
        document.getElementById("circle").style.left = point.x - radius + "px";
        document.getElementById("circle").style.width = radius * 2 + "px";
        document.getElementById("circle").style.height = radius * 2 + "px";
        document.getElementById("circle").style.borderRadius = radius + "px";
        document.getElementById("notice").innerHTML = "Pick a radius";
    }
    else {
        ctx.clearRect(0, 0, canvas.width, canvas.height);
        ctx.drawImage(img, imgposX, imgposY, imgsizeX, imgsizeY);
        var pos = getCursorPosition(canvas, e);
        radius = Math.sqrt(((pos.x - point.x) * (pos.x - point.x)) + ((pos.y - point.y) * (pos.y - point.y)));
        document.getElementById("circle").style.top = point.y - radius + "px";
        document.getElementById("circle").style.left = point.x - radius + "px";
        document.getElementById("circle").style.width = radius * 2 + "px";
        document.getElementById("circle").style.height = radius * 2 + "px";
        document.getElementById("circle").style.borderRadius = radius + "px";
        iD = ctx.getImageData(0, 0, canvas.width, canvas.height).data;
        draw(1);
        document.getElementById("notice").innerHTML = "Animating!";
    }
})
In this function, I also use the getCursorPosition function. This returns the position of the click as a coordinate on the canvas, given the canvas and click event.
function getCursorPosition(cvs, event) {
    const rect = cvs.getBoundingClientRect()
    const x = event.clientX - rect.left
    const y = event.clientY - rect.top
    return {
        "x": x,
        "y": y
    };
}
Animating the inversion
Finally, to animate the inversion, I create a function called draw(). This function takes a time t, and then scans over the entire canvas, and at each point solves the previously mentioned quadratic to find the colour at that point in the animation (time t).
When I draw the image, I store its data in a variable called iD. This is an array of bytes. The number of bytes is a multiple of 4, as every group of 4 bytes contains the red, green, blue and alpha (opacity) values for that pixel. The array contains data for every single pixel, scanning from left to right and then top to bottom. I use the iD variable in the draw function to create a byte array that represents the canvas at time t.
function draw(time) {
    document.getElementById("notice").innerHTML = "Animating! " + time * 100;
    // go through every pixel
    var pixels = ctx.getImageData(0, 0, canvas.width, canvas.height);
    var t = time;
    var h = canvas.height;
    var w = canvas.width;
    for (var i = 0; i < w; i++) {
        for (var j = 0; j < h; j++) {
            // step 1: figure out distance from the center
            var x = Math.sqrt(((i - point.x) * (i - point.x)) + ((j - point.y) * (j - point.y)));
            // step 2: work out a "unit vector"
            var uvec = {
                "x": (i - point.x) / x,
                "y": (j - point.y) / x
            }
            // step 3: solve for d
            var d1 = (x + Math.sqrt((x * x) + (4 * (t - 1) * t * radius * radius))) / (2 - (2 * t));
            var d2 = (x - Math.sqrt((x * x) + (4 * (t - 1) * t * radius * radius))) / (2 - (2 * t));
            if (t == 1) {
                d1 = (radius * radius) / x;
                d2 = d1;
            }
            if (d2 == 0) {
                d2 = d1;
            }
            if (t == 0) {
                d1 = x;
                d2 = x;
            }
            // step 4: get their original coordinates
            var c1 = {
                "x": Math.round((uvec.x * d1) + point.x),
                "y": Math.round((uvec.y * d1) + point.y)
            };
            var c2 = {
                "x": Math.round((uvec.x * d2) + point.x),
                "y": Math.round((uvec.y * d2) + point.y)
            };
            // check if any are out: if so, they go to the top left corner
            var fails = 0;
            if (c1.x < 0 || c1.x > w || c1.y < 0 || c1.y > h) {
                c1.x = c2.x;
                c1.y = c2.y;
                fails += 1;
            }
            if (c2.x < 0 || c2.x > w || c2.y < 0 || c2.y > h) {
                c2.x = c1.x;
                c2.y = c1.y;
                fails += 1;
            }
            if (fails == 2) {
                c1.x = 0;
                c1.y = 0;
                c2.x = 0;
                c2.y = 0;
            }
            // now get their colors: rgb and alpha
            var idxs1 = getColorIndicesForCoord(c1.x, c1.y, w);
            var idxs2 = getColorIndicesForCoord(c2.x, c2.y, w);
            var colors1 = [(iD[idxs1[0]] + iD[idxs2[0]]) / 2,
            (iD[idxs1[1]] + iD[idxs2[1]]) / 2,
            (iD[idxs1[2]] + iD[idxs2[2]]) / 2,
            (iD[idxs1[3]] + iD[idxs2[3]]) / 2];
            var idxsf = getColorIndicesForCoord(i, j, w);
            pixels.data[idxsf[0]] = colors1[0];
            pixels.data[idxsf[1]] = colors1[1];
            pixels.data[idxsf[2]] = colors1[2];
            pixels.data[idxsf[3]] = colors1[3];

        }
    }

    ctx.putImageData(pixels, 0, 0);
}
I repeatedly call the draw function to complete the animation.
I use the function getColorIndicesForCoord to find the index of a specific pixel in the byte arrays.
Full source code
In the source code, I have ommited the base64s for the images.
<html>

<head>
    <title>inversion</title>
    <style>
        #wrapper {
            position: relative;
        }

        #redpoint {
            position: absolute;
            width: 2px;
            height: 2px;
            background-color: red;
        }

        #circle {
            position: absolute;
            top: -10px;
            left: -10px;
            width: 20px;
            height: 20px;
            border-radius: 10px;
            border: 1px solid red;
        }
    </style>
</head>

<body>
    <div style="width: 100%; height: 10%">
        Image: <input type="file" id="currimage" /> <button onclick="handleImageb64(0)">Apollonian gasket</button>
        <button onclick="handleImageb64(1)">Shoemaker's Knife</button> <button onclick="handleImageb64(2)">Grid</button>
        <span id="notice">Pick a point </span><button onclick="next()">Next</button>
        <button onclick="overlayoriginal()">Overlay the original image</button>
    </div>
    <div id="wrapper" style="width: 100%; height: 90%">
        <canvas id="anim"></canvas>
        <div id="redpoint"></div>
        <div id="circle"></div>
    </div>
    <script>
        var base64s = [...];
        var stage = 0;
        var canvas = document.getElementById("anim");
        var ctx = canvas.getContext("2d");
        var img;
        var imgposX;
        var imgposY;
        var imgsizeX;
        var imgsizeY;
        var iD;

        // var onesquare = ctx.createImageData(1, 1); // only do this once per page
        // var od = onesquare.data;

        function getColorIndicesForCoord(x, y, width) {
            var red = y * (width * 4) + x * 4;
            return [red, red + 1, red + 2, red + 3];
        }

        var point = {
            "x": 0,
            "y": 0
        };
        var radius = 20;
        function handleImageBlob(blob) {
            var reader = new FileReader();
            reader.onload = function (event) {
                img = new Image();
                img.onload = function () {
                    // we want the width to be at most 60% and height to be at most 50%
                    // calculate what the width will be
                    stage = 0;
                    ctx.rect(0, 0, canvas.width, canvas.height);
                    var containerwidth = document.getElementById("wrapper").offsetWidth;
                    var widthonpage = Math.min(containerwidth * 0.66, img.width, 700);
                    var ratio = widthonpage / img.width;
                    canvas.width = widthonpage * 1.5;
                    canvas.height = img.height * ratio * 1.5;
                    imgposX = (canvas.width - widthonpage) / 2;
                    imgposY = (canvas.height - (img.height * ratio)) / 2;
                    imgsizeX = widthonpage;
                    imgsizeY = img.height * ratio;
                    ctx.drawImage(img, imgposX, imgposY, imgsizeX, imgsizeY);
                }
                img.src = event.target.result;
            }
            reader.readAsDataURL(blob);
        }
        function handleImage(e) {
            handleImageBlob(e.target.files[0]);
        }
        function handleImageb64(idx) {
            var url = base64s[idx];

            fetch(url)
                .then(res => res.blob())
                .then(handleImageBlob);
        }

        function overlayoriginal() {
            ctx.globalAlpha = 0.4;
            ctx.drawImage(img, imgposX, imgposY, imgsizeX, imgsizeY);
            ctx.globalAlpha = 1;
        }

        var state = 0;
        document.getElementById("wrapper").addEventListener("click", function (e) {
            if (stage == 0) {
                var pos = getCursorPosition(canvas, e);
                point = pos;
                document.getElementById("redpoint").style.top = pos.y + "px";
                document.getElementById("redpoint").style.left = pos.x + "px";
                document.getElementById("notice").innerHTML = "Pick a point";
            }
            else if (stage == 1) {
                var pos = getCursorPosition(canvas, e);
                radius = Math.sqrt(((pos.x - point.x) * (pos.x - point.x)) + ((pos.y - point.y) * (pos.y - point.y)));
                document.getElementById("circle").style.top = point.y - radius + "px";
                document.getElementById("circle").style.left = point.x - radius + "px";
                document.getElementById("circle").style.width = radius * 2 + "px";
                document.getElementById("circle").style.height = radius * 2 + "px";
                document.getElementById("circle").style.borderRadius = radius + "px";
                document.getElementById("notice").innerHTML = "Pick a radius";
            }
            else {
                ctx.drawImage(img, imgposX, imgposY, imgsizeX, imgsizeY);
                var pos = getCursorPosition(canvas, e);
                radius = Math.sqrt(((pos.x - point.x) * (pos.x - point.x)) + ((pos.y - point.y) * (pos.y - point.y)));
                document.getElementById("circle").style.top = point.y - radius + "px";
                document.getElementById("circle").style.left = point.x - radius + "px";
                document.getElementById("circle").style.width = radius * 2 + "px";
                document.getElementById("circle").style.height = radius * 2 + "px";
                document.getElementById("circle").style.borderRadius = radius + "px";
                iD = ctx.getImageData(0, 0, canvas.width, canvas.height).data;
                draw(1);
                document.getElementById("notice").innerHTML = "Animating!";
            }
        })
        document.getElementById("currimage").addEventListener('change', handleImage, false);

        function getCursorPosition(cvs, event) {
            const rect = cvs.getBoundingClientRect()
            const x = event.clientX - rect.left
            const y = event.clientY - rect.top
            return {
                "x": x,
                "y": y
            };
        }

        function next() {
            stage += 1;
            stage %= 3;

            if (stage == 0) {
                document.getElementById("notice").innerHTML = "Pick an image, then point";
                document.getElementById("redpoint").style.top = point.y + "px";
                document.getElementById("redpoint").style.left = pointpain.x + "px";
            }
            else if (stage == 1) {
                document.getElementById("circle").style.top = point.y - radius + "px";
                document.getElementById("circle").style.left = point.x - radius + "px";
                document.getElementById("circle").style.width = radius * 2 + "px";
                document.getElementById("circle").style.height = radius * 2 + "px";
                document.getElementById("circle").style.borderRadius = radius + "px";

                document.getElementById("notice").innerHTML = "Pick the radius";
            }
            else {
                iD = ctx.getImageData(0, 0, canvas.width, canvas.height).data;
                drawRec(0, 100);
                document.getElementById("notice").innerHTML = "Animating!";
            }
        }

        function drawRec(at, time) {
            console.log(at);
            if (at > 1) {
                draw(1);
            }
            else {
                draw(at);
            }
            if (at < 1) {
                setTimeout(drawRec, 25, at + (1 / time), time);
                //drawRec(at + (1 / time), time);
            }
        }

        function draw(time) {
            document.getElementById("notice").innerHTML = "Animating! " + time * 100;
            // go through every pixel
            var pixels = ctx.getImageData(0, 0, canvas.width, canvas.height);
            var t = time;
            var h = canvas.height;
            var w = canvas.width;
            for (var i = 0; i < w; i++) {
                for (var j = 0; j < h; j++) {
                    // step 1: figure out distance from the center
                    var x = Math.sqrt(((i - point.x) * (i - point.x)) + ((j - point.y) * (j - point.y)));
                    // step 2: work out a "unit vector"
                    var uvec = {
                        "x": (i - point.x) / x,
                        "y": (j - point.y) / x
                    }
                    // step 3: solve for d
                    var d1 = (x + Math.sqrt((x * x) + (4 * (t - 1) * t * radius * radius))) / (2 - (2 * t));
                    var d2 = (x - Math.sqrt((x * x) + (4 * (t - 1) * t * radius * radius))) / (2 - (2 * t));
                    if (t == 1) {
                        d1 = (radius * radius) / x;
                        d2 = d1;
                    }
                    if (d2 == 0) {
                        d2 = d1;
                    }
                    if (t == 0) {
                        d1 = x;
                        d2 = x;
                    }
                    // step 4: get their original coordinates
                    var c1 = {
                        "x": Math.round((uvec.x * d1) + point.x),
                        "y": Math.round((uvec.y * d1) + point.y)
                    };
                    var c2 = {
                        "x": Math.round((uvec.x * d2) + point.x),
                        "y": Math.round((uvec.y * d2) + point.y)
                    };
                    // check if any are out: if so, they go to the top left corner
                    var fails = 0;
                    if (c1.x < 0 || c1.x > w || c1.y < 0 || c1.y > h) {
                        c1.x = c2.x;
                        c1.y = c2.y;
                        fails += 1;
                    }
                    if (c2.x < 0 || c2.x > w || c2.y < 0 || c2.y > h) {
                        c2.x = c1.x;
                        c2.y = c1.y;
                        fails += 1;
                    }
                    if (fails == 2) {
                        c1.x = 0;
                        c1.y = 0;
                        c2.x = 0;
                        c2.y = 0;
                    }
                    // now get their colors: rgb and alpha
                    var idxs1 = getColorIndicesForCoord(c1.x, c1.y, w);
                    var idxs2 = getColorIndicesForCoord(c2.x, c2.y, w);
                    var colors1 = [(iD[idxs1[0]] + iD[idxs2[0]]) / 2,
                    (iD[idxs1[1]] + iD[idxs2[1]]) / 2,
                    (iD[idxs1[2]] + iD[idxs2[2]]) / 2,
                    (iD[idxs1[3]] + iD[idxs2[3]]) / 2];
                    var idxsf = getColorIndicesForCoord(i, j, w);
                    pixels.data[idxsf[0]] = colors1[0];
                    pixels.data[idxsf[1]] = colors1[1];
                    pixels.data[idxsf[2]] = colors1[2];
                    pixels.data[idxsf[3]] = colors1[3];

                }
            }

            ctx.putImageData(pixels, 0, 0);
        }
    </script>
</body>
</html>