Converting images and videos to ASCII art with Python
A program that uses convolutions to quickly (< 1s) make ASCII art and ASCII videos.
For a while now, I’ve wanted to automatically create ASCII art, and I’ve ended up with a couple of approaches to the problem, and I’ve even managed to make some videos of memes with it.
My final approach uses the Sobel operator and convolutions utilising complex numbers to create ASCII art that respects the edges of an original photo.
As always, skip to the end to see the end result if you are non-technical.
Some ideas for approaches
Throughout this article, I’ll be using this image of a rocket as an example.

As ASCII characters do not have colour, it makes sense to only deal with the grayscale version of the image, which is also above.
Let’s get some ideas out of the way first.
One very simple (but not particularly interesting) way to approach this problem is by trying to divide the grid into lots of little monospaced rectangles (one for each character).
Each cell will have a percentage darkness. We can work out this percentage darkness by averaging out the darknesses of all the pixels in each cell. Similarly, we can do this for each character, and put the character with the most similar percentage darkness in each cell.
However, our eyes also average out brightnesses. This means that if the characters are small enough, we won’t be able to tell what they are and will just end up seeing an image quite close to the grayscale approaches
A failing approach - matching by pixel difference
My next idea was not successful, but I’ll document it here anyway, maybe as a warning to any other ambitious nerds.
I decided I would abandon the cells altogether.
Instead, I decided to split the image into rows, and in each row, I would try to come up with a list of characters that matches it as well as possible. This allows me to use fonts that aren’t monospaced.
I would continually add a small amount of “extra room” for the next character, and each time I did this, I would add the character has the smallest pixel wise squared difference from the original image.
This was accomplished with this code:
for y in range(0, y_size - line_height, line_height):
        last_ending = 0
        chars = ""
        step = font_size // 2
        for x in range(step, x_size, step):
            imgsegment = grey[last_ending:x, y:(y + line_height)]
            best_match = None
            best_score = float('inf')
            for char, arr in glyphimages:
                char_cp = chars + char
                newlen = int(font.getlength(char_cp))
                # newlen = last_ending + arr.shape[0]
                if (newlen <= x) and (arr.shape[0] < (x - last_ending)):
                    # now calculate the difference from grayscale
                    # slice the bit we need and sum the bit we dont
                    needed = imgsegment[0:(arr.shape[0])]
                    unneeded = imgsegment[(arr.shape[0]):]
                    diff = needed - arr
                    unneeded = 1 - unneeded
                    diff = np.sum(diff * diff)
                    unneeded = np.sum(unneeded * unneeded)
                    score = diff + unneeded
                    #print(char, score)
                    if (score < best_score):
                        best_score = score
                        best_match = char
            if (best_match != None):
                chars = chars + best_match
                last_ending = int(font.getlength(chars))
                # newlen = last_ending + arr.shape[0]
        print(chars)
        # this part draws the character in
        draw_finished.text((0, y), chars, (0,), font=font)
However, this approach had many limitations that I found out at various times.
- It does not respect the shape of the image. For example, lines that would cross over the top of the cell (‾) would have no good matches with my character set, and the best character that would end up being used was the space.
- It can be forced to make bad matches. As only a small amount of space is added for a new character each time, many wider characters that may have been better fits will never be tested against the space.
- It has huge performance limitations. This requires Pillow’s
font.getlengthfunction, which is very slow as it has to draw out characters onto a canvas to get their length. This can result in small individual images taking minutes to make. Still faster than a human though!
On the other hand, this approach does have the advantage of supporting variable width fonts.
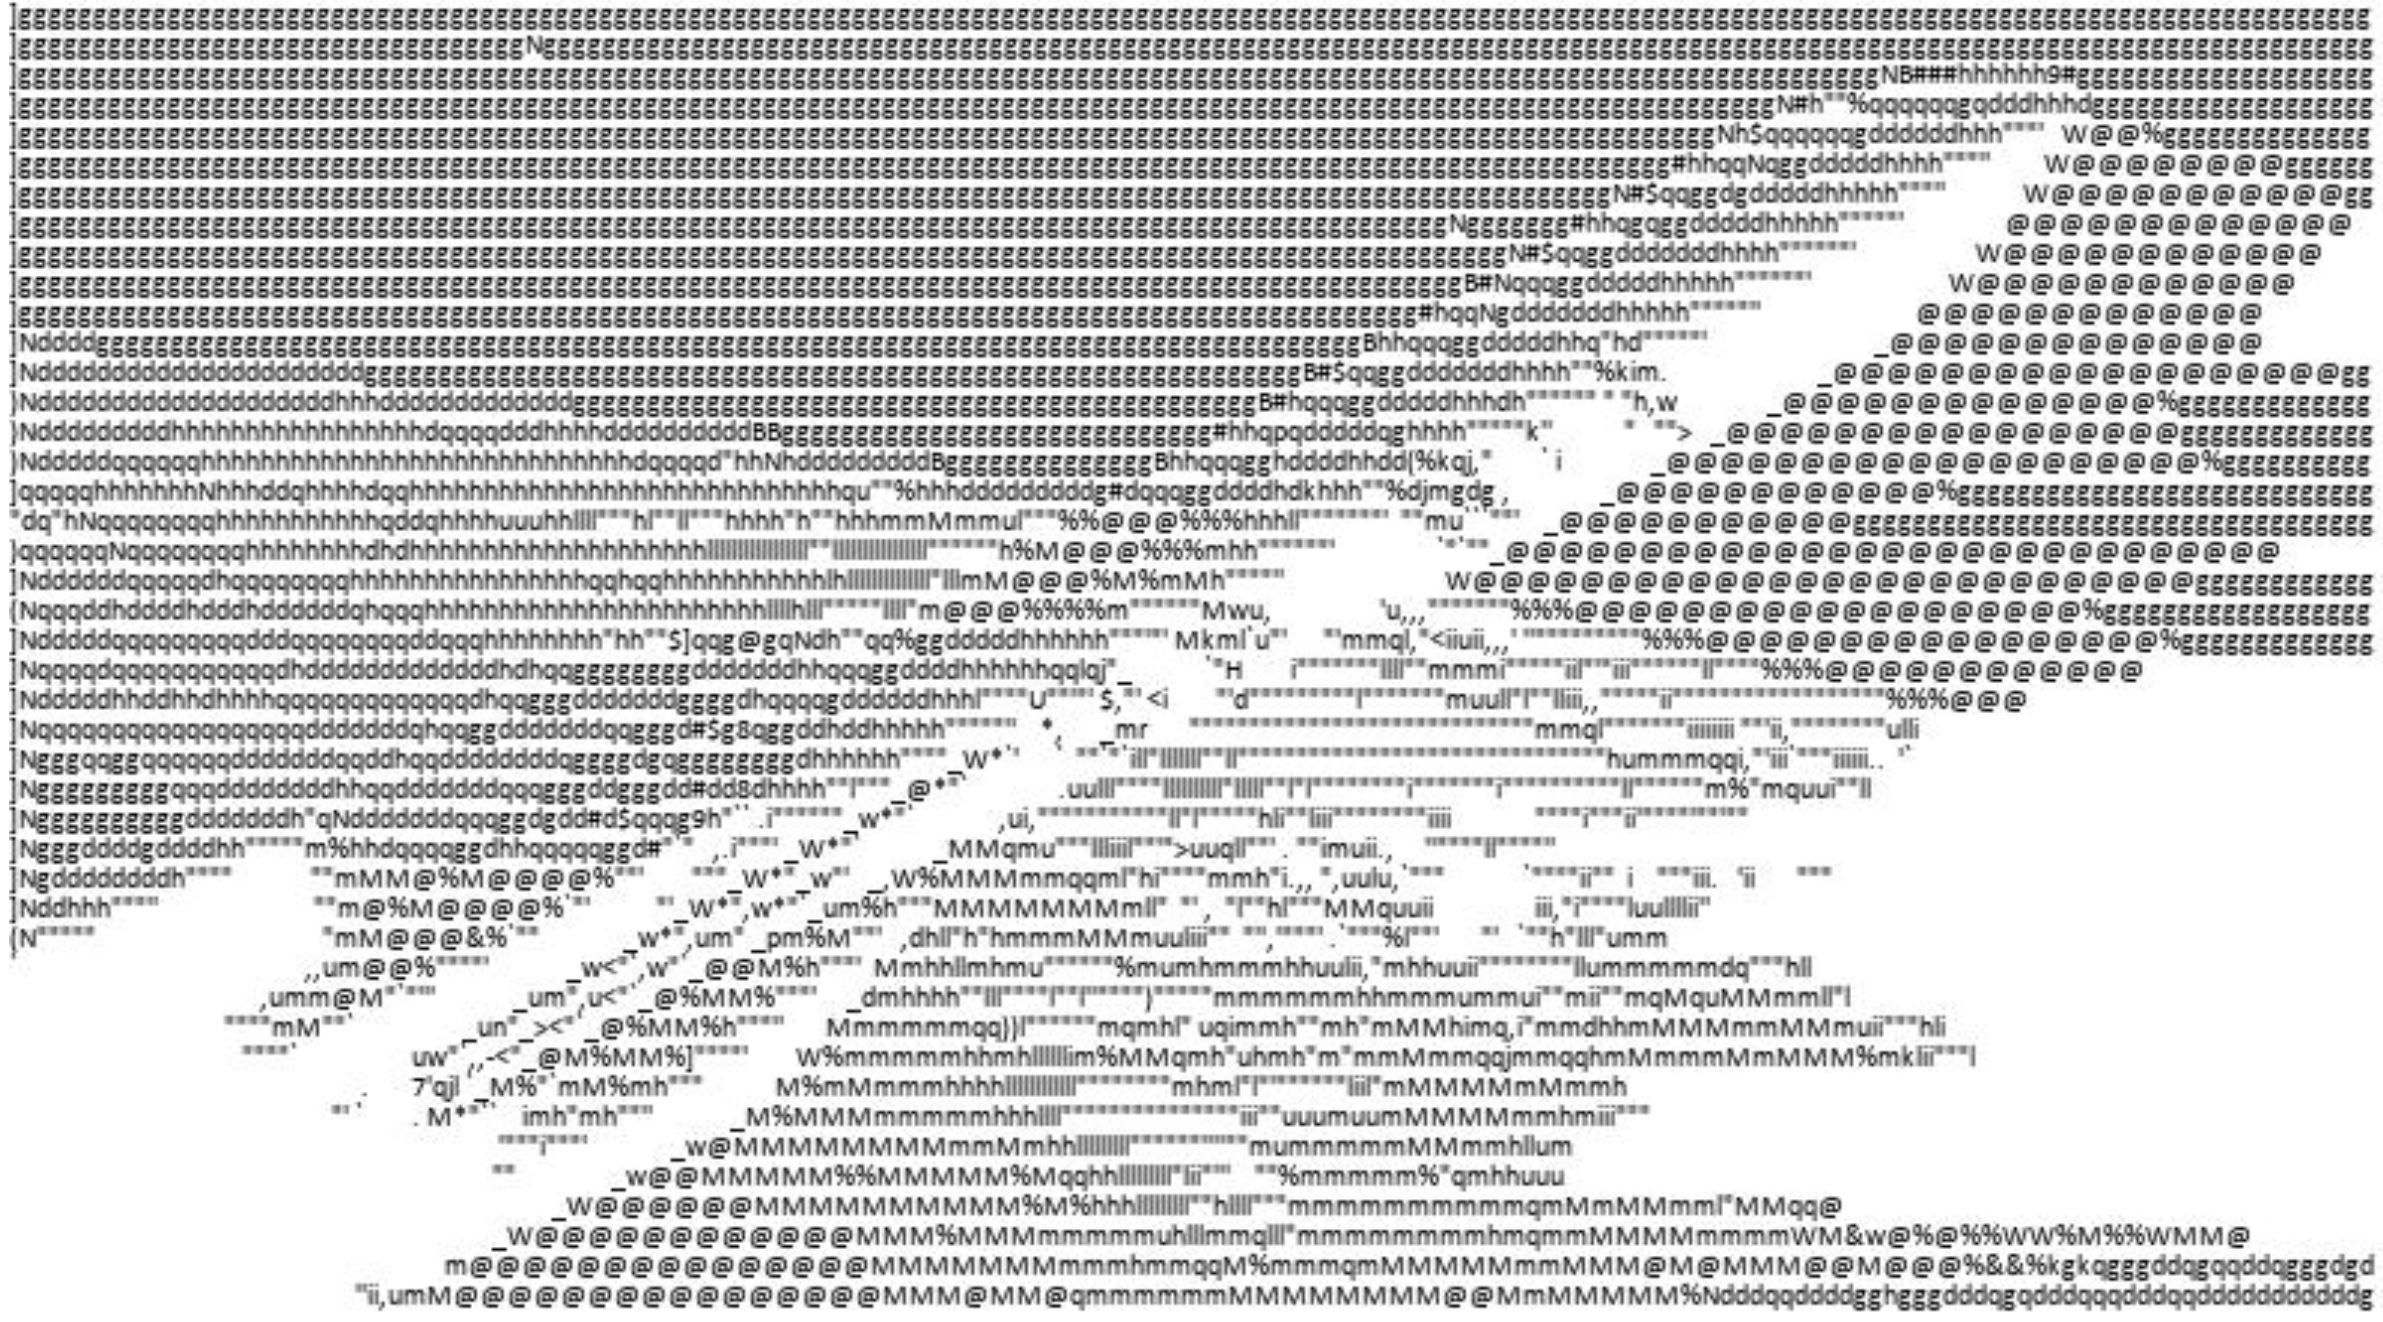
Here is the rocket with this approach and Calibri.

While this can make some light areas light, it doesn’t really respect the shape of the rocket and leaves large areas blank for unknown reasons. On the plus, you could theoretically copy this into a Word document and be left with your rocket unharmed.
A better approach - weighted matching with gradient and lightness
For a start, I switched back to a monospaced font. This kills two birds with one stone, preventing the bad matching and performance limitation issues.
Unfortunately, I did not version control this approach in stages (it did only take a couple hours), so I will attempt to retell the story of the optimisation of this project. Even more unfortunately, in going back and forth trying to get intermediate stages for this article, I appear to have lost a final working program, but all the ideas are still the same.
I decided I wanted to look at the direction of edges in each cell and place the character that had the most similar direction of edges.
First, I needed a simple and time efficient way to get the direction of edges in each cell.
I decided to use a Sobel operator.
This is an operation that allowed me to quickly get an idea of the derivative at each point.
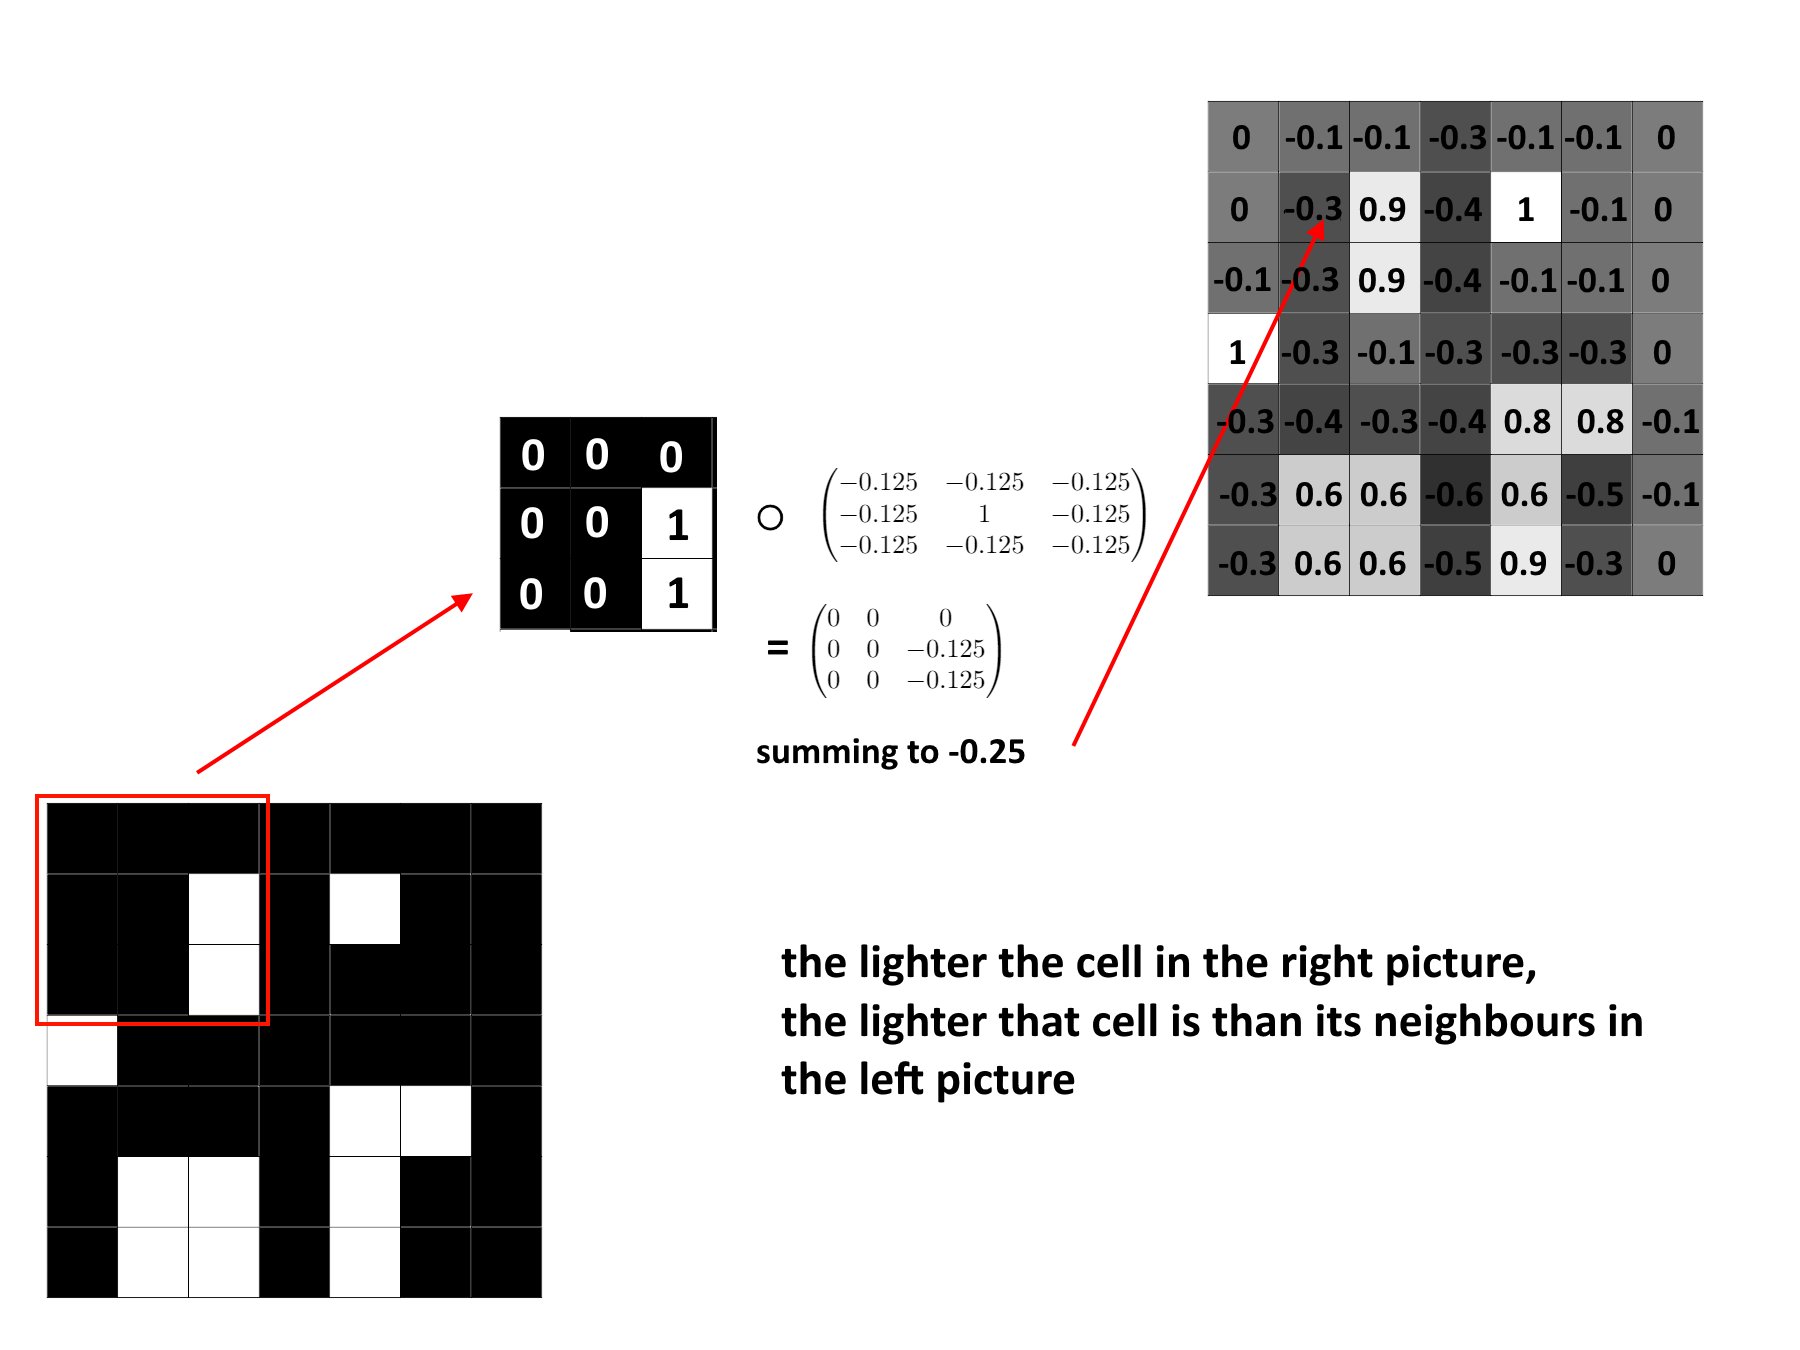
First of all, this operator uses convolutions. This is a long way to say that each cell turns into a weighted sum of its neighbours. This weighted sum is usually represented by a matrix called the kernel.
For example, if I wanted a convolution that told me, for example, how different each pixel is from its neighbours, I could use the kernel \(\begin{pmatrix}-0.125 & -0.125 & -0.125\\-0.125 & 1 & -0.125\\-0.125 & -0.125 & -0.125\end{pmatrix}\). For each cell, this would give the value of the cell itself minus the average of the cells surrounding it. This is illustrated with an example below.

The Sobel operator uses two matrices. First of all, if there’s an edge horizontally, the top cells are brighter than the bottom cells, and so we can use the kernel \(\begin{pmatrix}1 & 2 & 1\\0 & 0 & 0\\-1 & -2 & -1\end{pmatrix}\) to detect these. Similarly, to detect vertical edges, we can use the kernel \(\begin{pmatrix}1 & 0 & -1\\2 & 0 & -2\\1 & 0 & -1\end{pmatrix}\).
One neat trick to combine both of these two is to use complex numbers. If we make the vertical part an imaginary component, we can combine the two matrices into one: \(\begin{pmatrix}1 + i & 2 & 1 - i\\2i & 0 & -2i\\-1 + i & -2 & -1 - i\end{pmatrix}\). Now, each cell will contain a complex number with angle equal to the direction of the edge/gradient at that point.
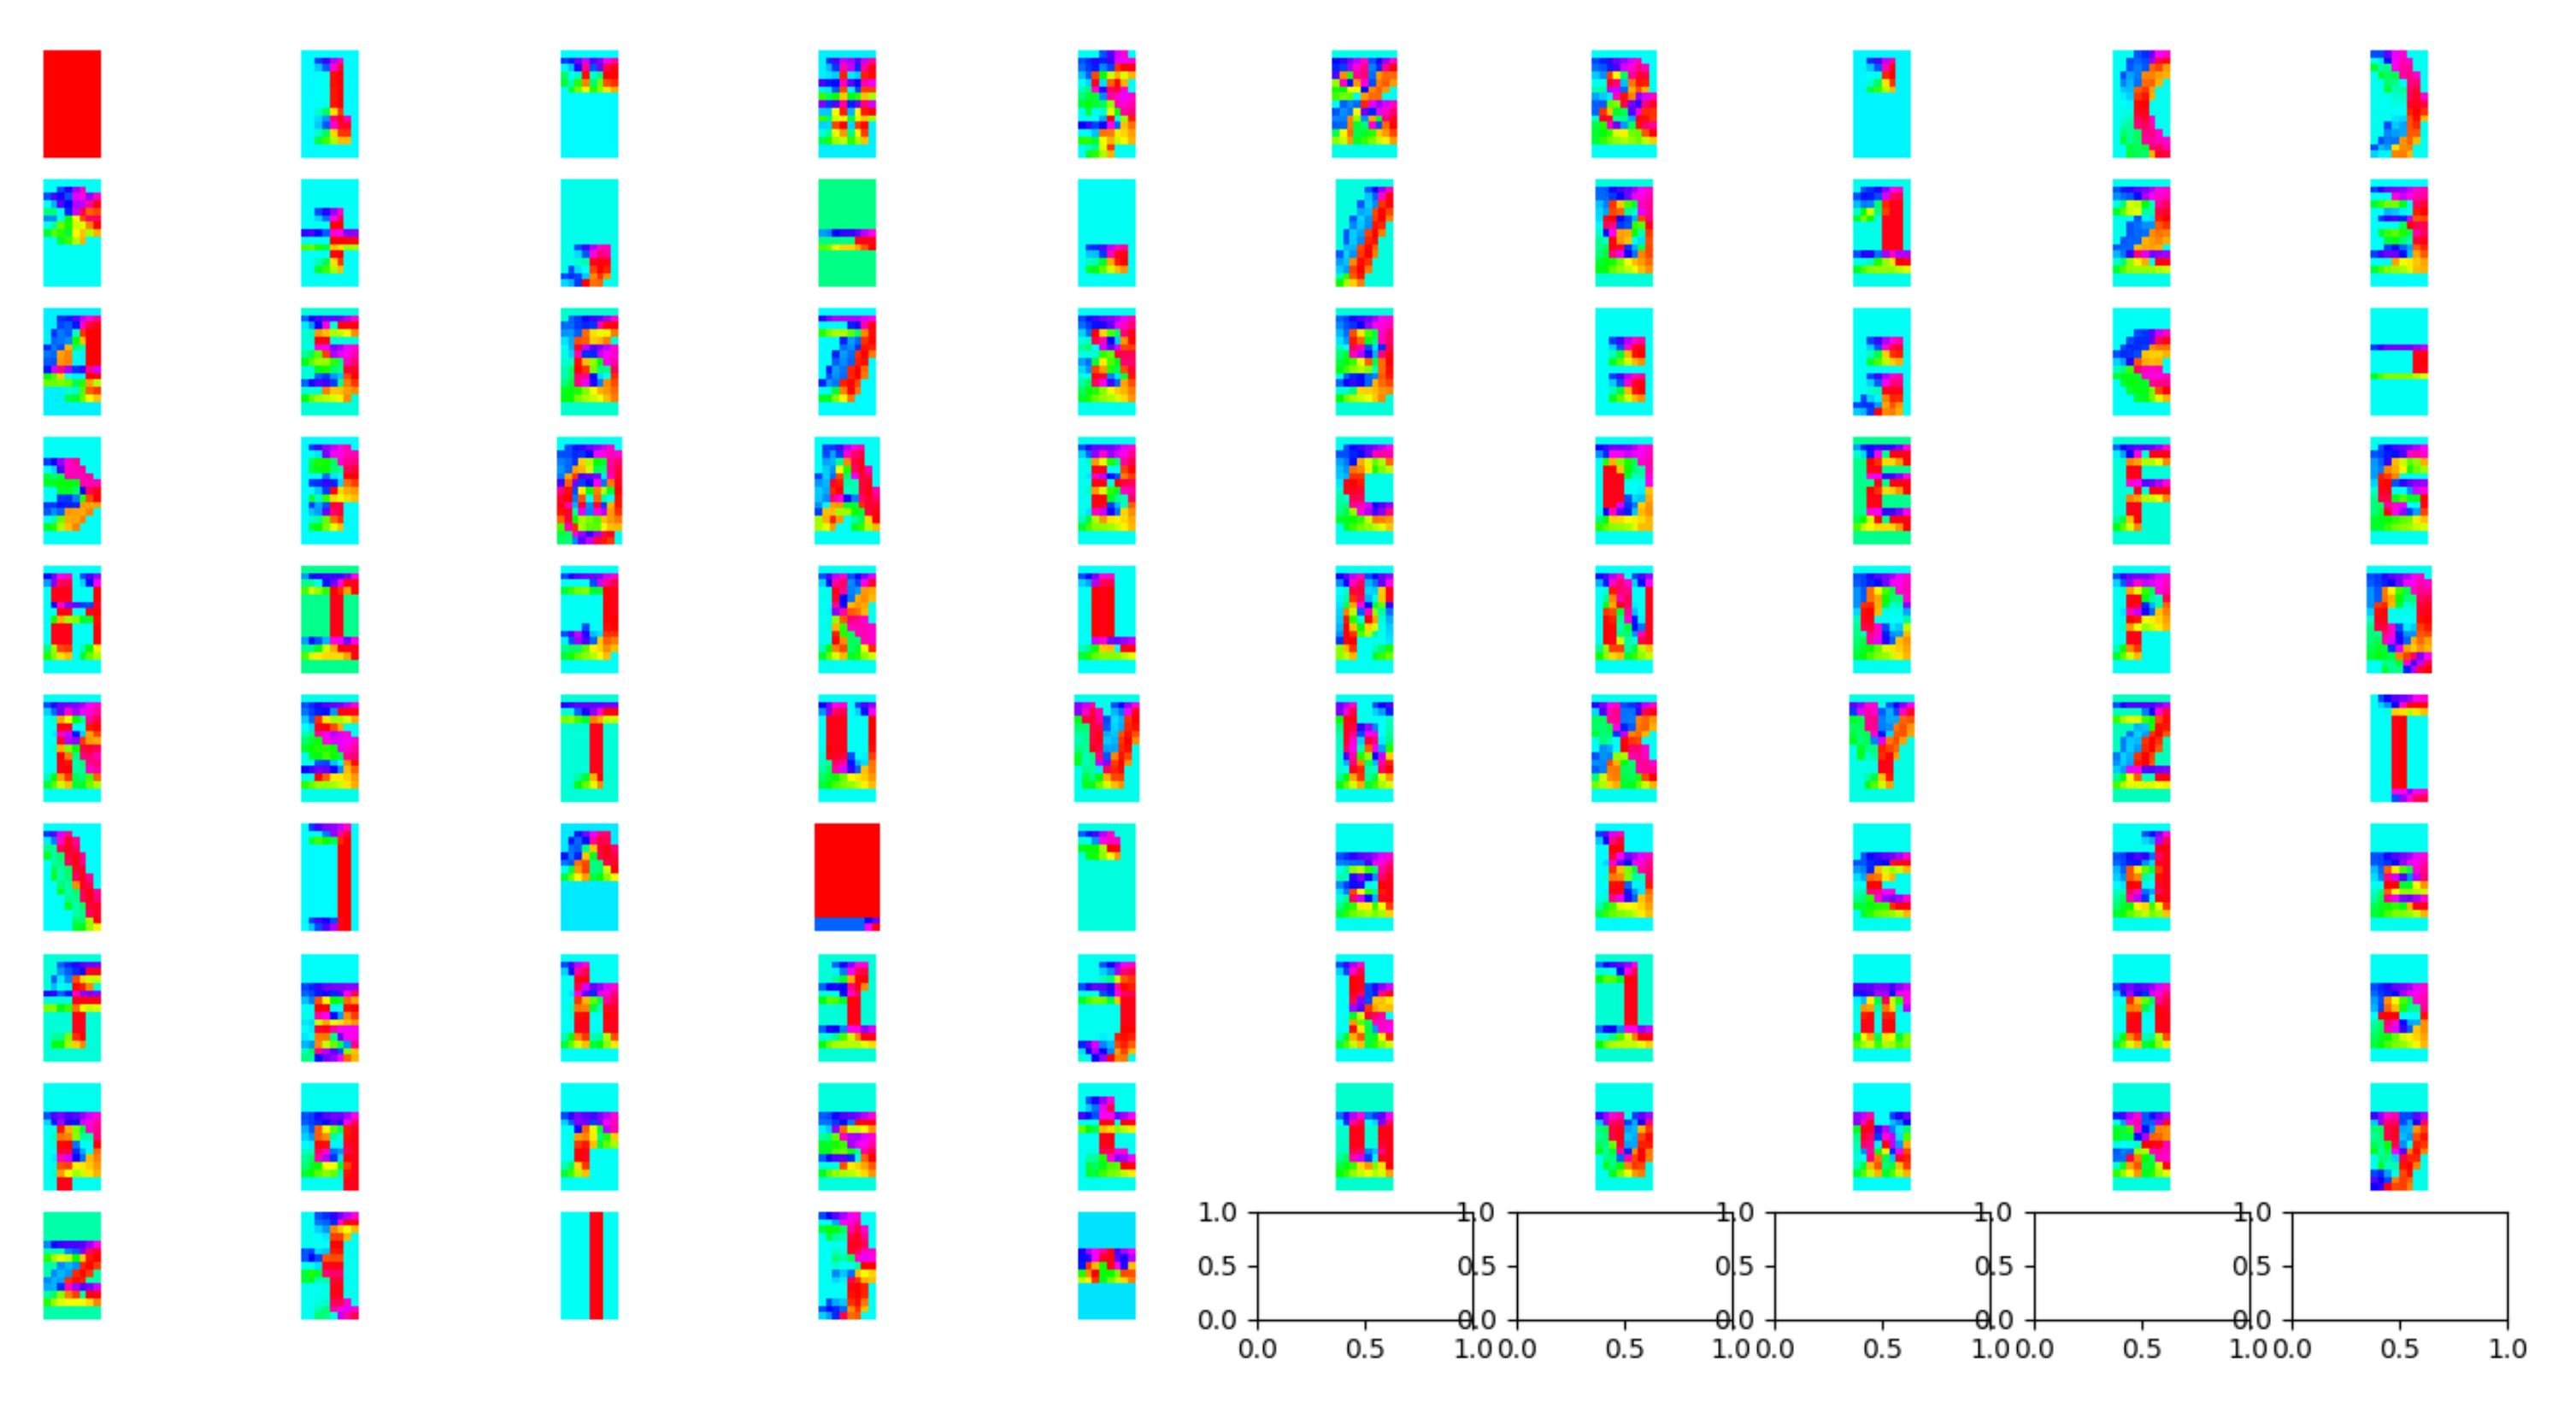
I used matplotlib to show the angle at each point as a colour corresponding to that angle on the HSV scale (which may be the topic of another article soon ;)) for all characters in my character set, and got this nice plot:

Next, I decided to change all of the angles to be in the range 0 to π. I add π to all negative angles to do this, as this doesn’t impact its direction. This means that two edges of one line won't "cancel each other out".
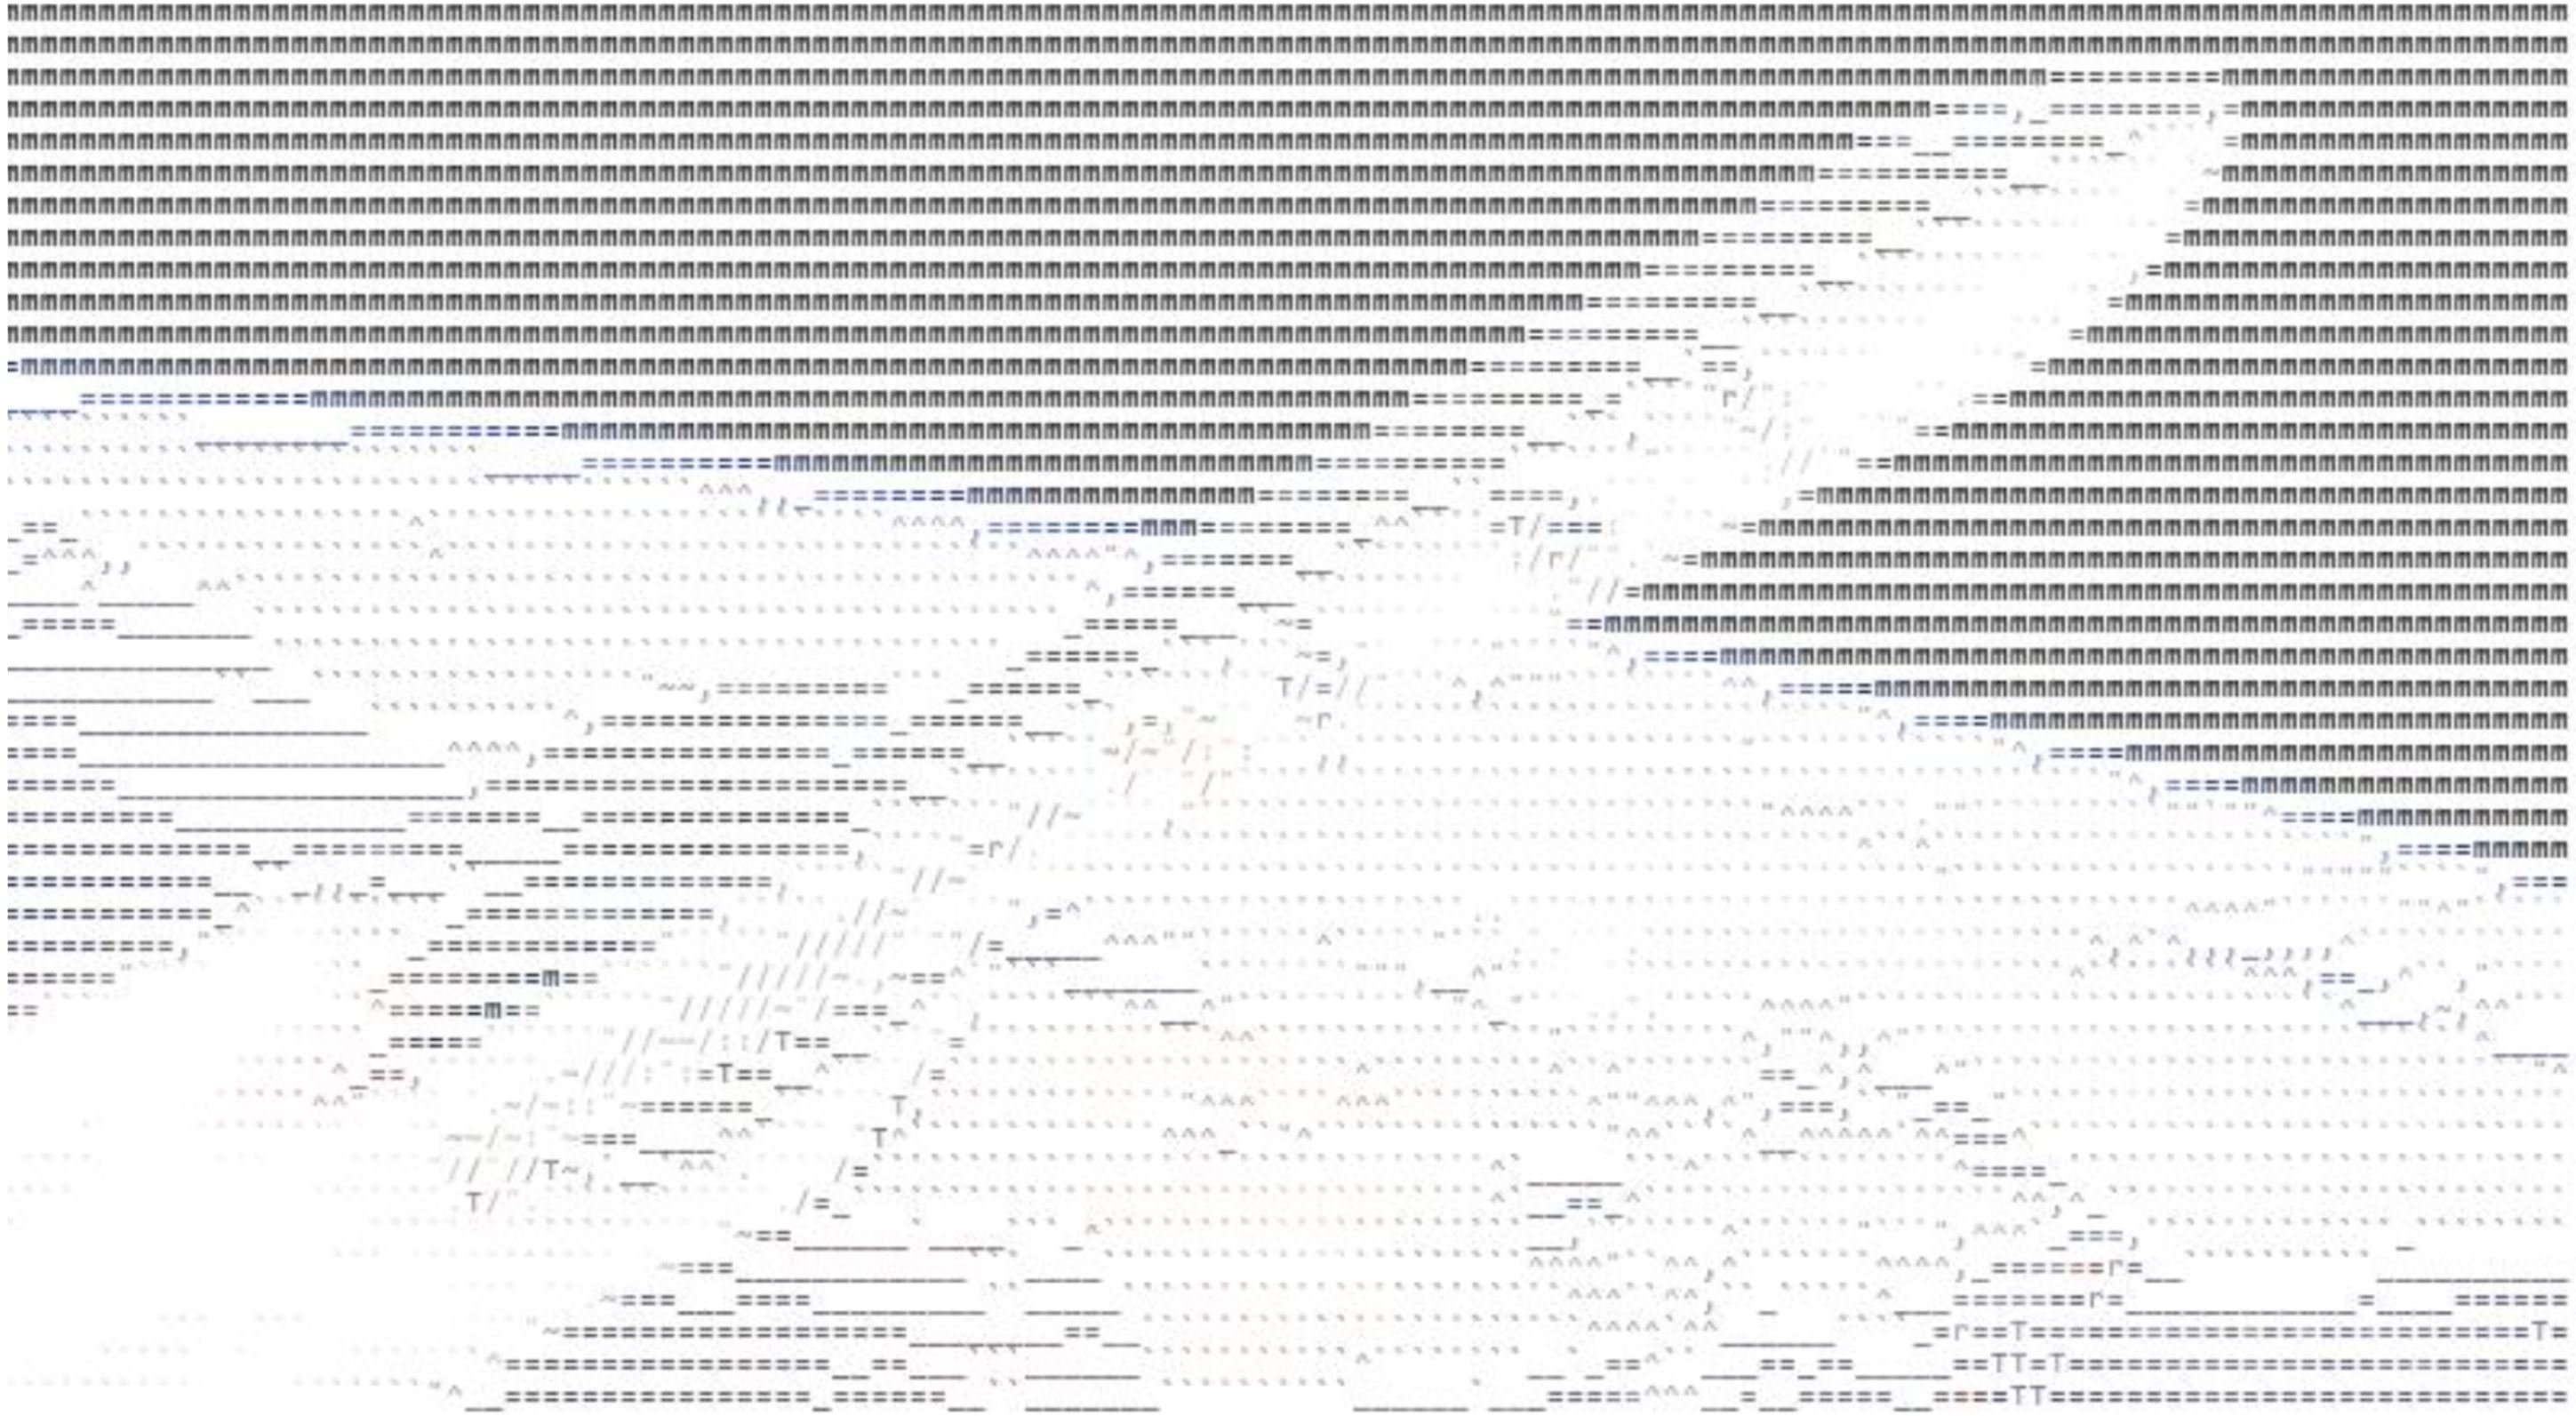
Afterwards, I summed all of the complex numbers over each character to get an overall “gradient” for the character. I could then do this for each cell of the image and try to match the best character in each place (below, left).
While this is able to respect the gradient of edges of the rocket better in some cases, this does not factor in the darkness of each individual cell as well. The black abyss of space and the Earth appear to be similarly shaded, while being very different in brightness.
I started by simply adding a heuristic for darkness in each cell, and got the image on the right above. While this is an improvement, it isn’t using the darkest possible characters for the sky. This is because the weighting applied to the angle is still taking precedence. To solve this issue, I give the darkness heuristic a larger weighting (\(\frac{1}{magnitude + 0.05}\)) when the magnitude of the gradient is small. I also made each character be the colour of the cell below it to give a nicer image.

One final but very important optimisation that I made was in the character calculations. Originally, I calculated the score for each character based on its angle, magnitude and darkness independently in a loop. However, doing this in a numpy array gives a huge, 4 fold speedup, as it is optimised in C (and maybe even uses multithreading magic to do the computations in parallel). This allows one image to be done in under a second.
I was now at a point where I was happy with the result (and too tired to try any more - you can probably tell by the quality of this article), so I packaged all this work into one big package. This allowed me to reuse the same code to make videos out of lots of frames of pictures, which is probably what you’re here for. I hope you didn’t skip here!
Maybe I should come up with something for you to do if you skip right here. Maybe some quizzes or something? At least you could then give me some data to play with. Edit: now I have - scroll to the bottom :)
Never mind, here’s the bonk meme as an ASCII video:
And a pretty cool music video as an ASCII video:
Help me with a future article
You will have to draw pictures in the square box from the prompts given in a limited amount of time and ink. As time goes on, your level will increase and you will have less time to draw.
Please try to keep the drawings close enough to the actual prompt - skip if something is too hard to draw.
Press begin to start the game :)
If you choose to enter a name, it may be displayed with your drawings on the internet.
Ready to draw?
Drawings:
0